The U.S. Department of Agriculture posted its January 2026 Supplemental Nutrition Assistance Program tables on the Food and Nutrition Service data page this month, and the headline number is the lowest the program has recorded since the spring of 2020. Average monthly participation in January was 38.5 million people, down from a fiscal-year 2024 average of 42.1 million and from roughly 42 million as recently as July 2025. The six-month change is a decline of about 3.6 million enrollees, or 8.5 percent of the pre-megabill caseload. Stack the monthly figures since fiscal year 1976, when the modern program began, and no six-month interval outside a deliberate eligibility purge has fallen that fast.
The proximate cause is policy. President Trump signed H.R. 1, the budget reconciliation package now widely called the “One Big Beautiful Bill Act,” on 4 July 2025. Section 10102 of that law raised the upper age for the SNAP able-bodied adults without dependents work requirement from 54 to 64, narrowed the dependent-child exemption to apply only when the youngest child is under 14, and limited the conditions under which states can waive the three-month time limit in areas with high unemployment. The Food and Nutrition Service issued its ABAWD waiver implementation memorandum in the second half of 2025, and states began applying the new rules across the fall. The January 2026 data is the first full month after the bulk of those changes were in effect.
How the comparison is built
Three numbers carry the lead. The first is the fiscal-year 2024 average of 42.1 million people per month, which the USDA Economic Research Service SNAP Data System publishes as the standard pre-megabill baseline. The second is the July 2025 reading of approximately 42 million, the last full month before the new work-requirement and waiver rules began to bite. The third is the January 2026 reading of 38.5 million, from the Food and Nutrition Service monthly persons table released this May. Each is a national average for the month, not a point-in-time count, and each is reported with a roughly three-to-four-month lag because state agencies submit administrative data on a rolling schedule. The window chosen, July 2025 through January 2026, corresponds to the period after the law was signed and before the next round of state recertifications could partially correct over-denial errors; comparisons that extend further back across the 2023 emergency-allotment unwind would conflate two distinct policy shocks.
The percentage figure is straightforward arithmetic. The drop from 42.1 million to 38.5 million is 3.6 million people. Expressed as a share of the 42.1 million baseline, that is 8.55 percent. The Center on Budget and Policy Priorities, which has been maintaining a public SNAP tracker since shortly after the law was signed, cites the figure as “more than 3 million” and “8 percent,” using the lower bound of the July baseline; the rounding choice does not change the direction or the order of magnitude.
What the unemployment data does and does not say
A 3.6 million-person decline in food assistance over six months would be the natural result of a hiring boom, if there had been one. There has not. The Bureau of Labor Statistics reported a national unemployment rate of 4.3 percent in March 2026, against 4.2 percent in July 2025, a one-tenth-of-a-point move in the direction of slightly more, not less, unemployment. The Job Openings and Labor Turnover Survey for March, released on 5 May, showed 6.9 million openings, the same as February and below the 7.4 million reading from July 2025. The labor market through which a former SNAP recipient would have to walk to no longer need benefits is, in aggregate, modestly tighter than it was on the day the bill was signed. The data does not support a story in which 3.6 million people found jobs that lifted them above the SNAP gross-income limit of 130 percent of the federal poverty line.
Arizona’s caseload has fallen by more than half in six months. The state’s unemployment rate over the same period rose from 4.0 to 4.7 percent. — Center on Budget and Policy Priorities SNAP tracker, May 2026
Where the decline concentrates
The state-by-state geometry of the drop is not even. CBPP’s tracker, which is built from the same FNS monthly tables, shows declines in every state except Alaska, Hawaii, and Kentucky. Arizona is the steepest case: the state recorded roughly 509,700 SNAP participants in January 2026, against more than 1.05 million as recently as July 2025, a fall of more than 51 percent in six months. Georgia is next, down about 26 percent year-over-year from 1.94 million in January 2025 to 1.43 million in January 2026. Florida, North Carolina, Tennessee, and Virginia all sit in the 10 to 20 percent range for the same window. Together, Arizona, Florida, and Georgia account for nearly a third of the national decline.
The Arizona figure deserves a brief detour. The state’s own Department of Economic Security has acknowledged that part of the decline reflects administrative tightening, namely payment-error-rate reduction efforts that the megabill created a strong fiscal incentive to pursue. The law penalizes states with high payment-error rates by requiring them to assume a larger share of program costs. A state that closes cases aggressively in response to the work requirement, the new waiver rules, and the payment-error pressure can record a participation drop that is larger than the policy-eligible drop would predict on its own. The CBPP analysis describes the Arizona situation in those terms; the state’s independent center for economic progress, an analytical group at the state capitol, has flagged the same point. The household data does not yet let an outside analyst separate the share of the Arizona decline that is eligibility-driven from the share that is procedural; that will take another two or three quarters of caseload data and the next round of state-reported quality-control samples.
What the chart would show
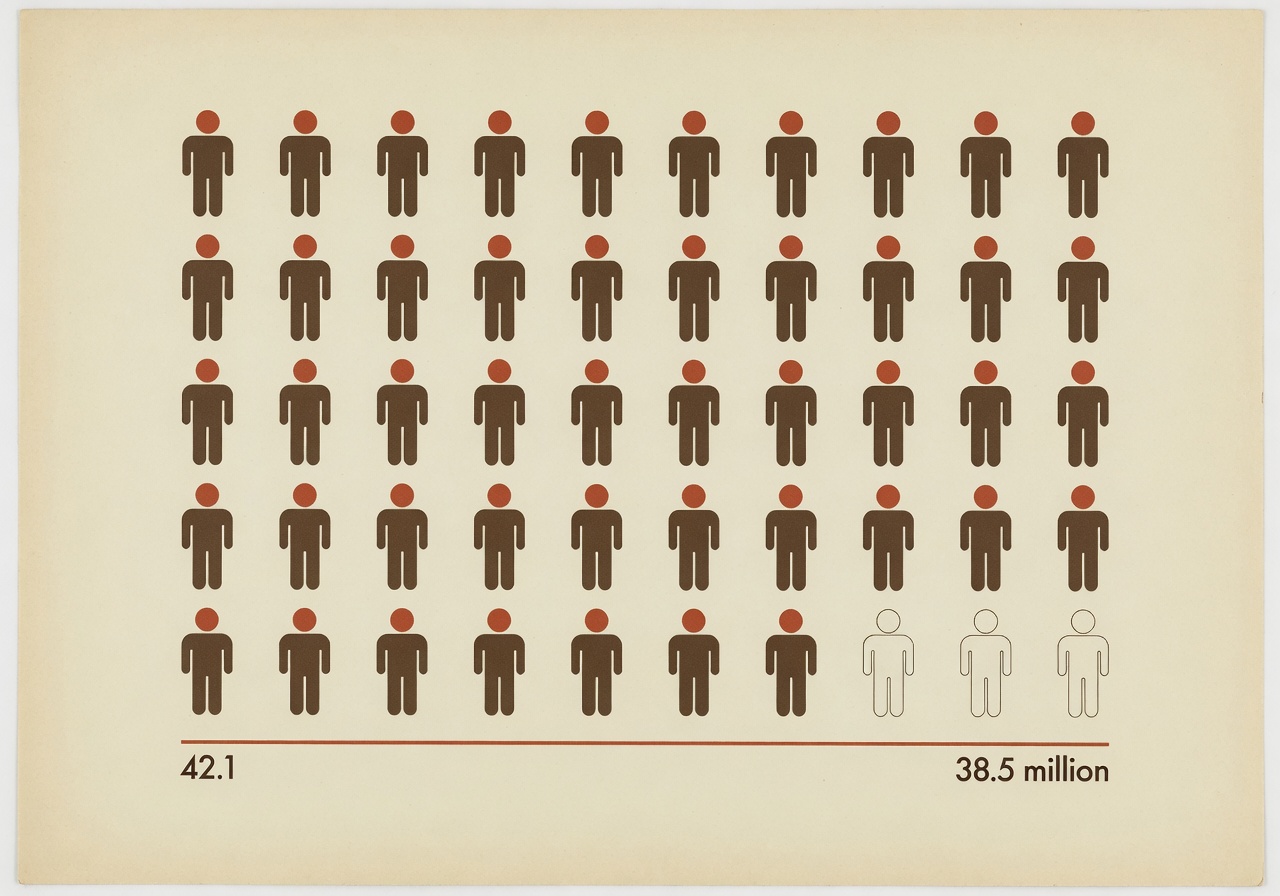
The visualization built into this article is an isotype-pictogram grid, a Vienna-Method device that Otto Neurath’s team designed for exactly the problem of communicating large counts of people to readers who would otherwise read past a seven-digit number. Forty stylized human figures stand for the 42.1 million pre-megabill SNAP participants, one figure per million, rounded for legibility. Three figures, drawn in faint outline at the lower-right corner of the grid, stand for the 3.6 million people no longer in the program in January. The arithmetic of the rest of this story sits inside that subtraction. A reader who looks at the grid for a second has the right picture; a reader who looks for ten seconds has the question.
What the data does not capture
The FNS monthly tables count people who received a benefit in a given month. They do not count people who lost benefits but remained food-insecure, people whose applications were denied at intake rather than removed from an active caseload, or people whose household composition shifted in response to the new rules in ways that changed reported eligibility without changing actual need. The USDA Economic Research Service’s annual Household Food Security report will be the first instrument to register those changes; the 2025 release, due in September, will cover the calendar-year 2025 reference period, which only partially overlaps with the post-megabill window. The Census Bureau’s Household Pulse Survey, which carries a food-sufficiency question on every bimonthly wave, will be the earlier read. Neither will let us answer, this summer, the question that matters most: of the 3.6 million people who are no longer on SNAP, how many are now eating less than they did in June 2025. That is the chart a future release will let us draw.