Two federal surveys went into the field in the back half of 2025 to measure how widely artificial intelligence has been adopted in the United States, and they came back with figures that disagree by a factor of more than two. The Census Bureau’s Business Trends and Outlook Survey, which asks firms whether they use AI in any of their business functions, put the share at about 18 percent of employer businesses as of year-end 2025. The Real-Time Population Survey, summarized in a Federal Reserve research note dated 3 April 2026, put the share of workers using generative AI on the job at roughly 41 percent in the same window. The April 23 release of the Household Trends and Outlook Pulse Survey, the household side of the same Census program, added a third reading: a public-use sample of about 30,000 households reporting their own AI use in the prior two months. Stacked next to one another, the three numbers describe the same phenomenon from three angles, and the angles do not line up.
The gap is not a measurement error. The Census BTOS and the Real-Time Population Survey are well-designed instruments. The BTOS samples 200,000 employer businesses per panel and runs in continuous biweekly waves; the RPS samples 5,000 to 6,000 working-age adults each quarter with weighting that tracks the Current Population Survey. They are asking different questions. The BTOS asks an enterprise whether it has adopted AI as a tool the firm uses. The RPS asks a worker whether the worker uses AI to do the worker’s job. The headline distance between 18 percent and 41 percent is the distance between policy adoption and individual practice: the share of work that gets done with AI assistance even when the employer has not yet formally signed off on the tool.
What each survey actually measures
The BTOS figure is the easiest to misread. The November 2025 revision of the AI question broadened the wording from "AI used in producing goods or services" to AI used "in any of its business functions," covering marketing, accounting, HR, customer support, and internal documentation. The broader wording is the reason the firm-reported number climbed from 3.8 percent in mid-2023 to 18 percent at the end of 2025. About 12 of those points are real adoption growth; the rest is the question catching up to what firms were already doing. Adoption is highest in Professional Services and Financial Services at roughly 30 percent of firms, and lowest in Accommodation and Food at 8 percent. Firms with more than 250 employees report adoption at about 30 percent, roughly two-thirds higher than the all-firms figure.
The Federal Reserve note layers a second instrument on top of that: the Atlanta Fed’s Survey of Business Uncertainty, which produces an employment-weighted reading. Weighted by headcount rather than by firm count, the share of workers employed at an AI-adopting firm reaches 78 percent. That number tells a different story than the firm-count figure. The 18 percent of firms that have adopted AI are disproportionately the large firms where most American workers actually work, so the share of the workforce sitting inside an AI-adopting employer is much larger than the share of employers adopting AI. The 78 percent figure and the 18 percent figure are not in conflict; they are answers to two different questions.
The worker-reported 41 percent sits between them, and it answers a third question: not whether the worker’s firm has adopted AI, but whether the worker uses AI to do the worker’s job. That figure rose from 30.1 percent in December 2024 to 45.9 percent in the June–July 2025 wave of the Real-Time Population Survey, a 15.8 percentage point jump in six months and the steepest in the series. Daily use among the working-age population reached 12 percent in November 2025; weekly use reached 35.2 percent.
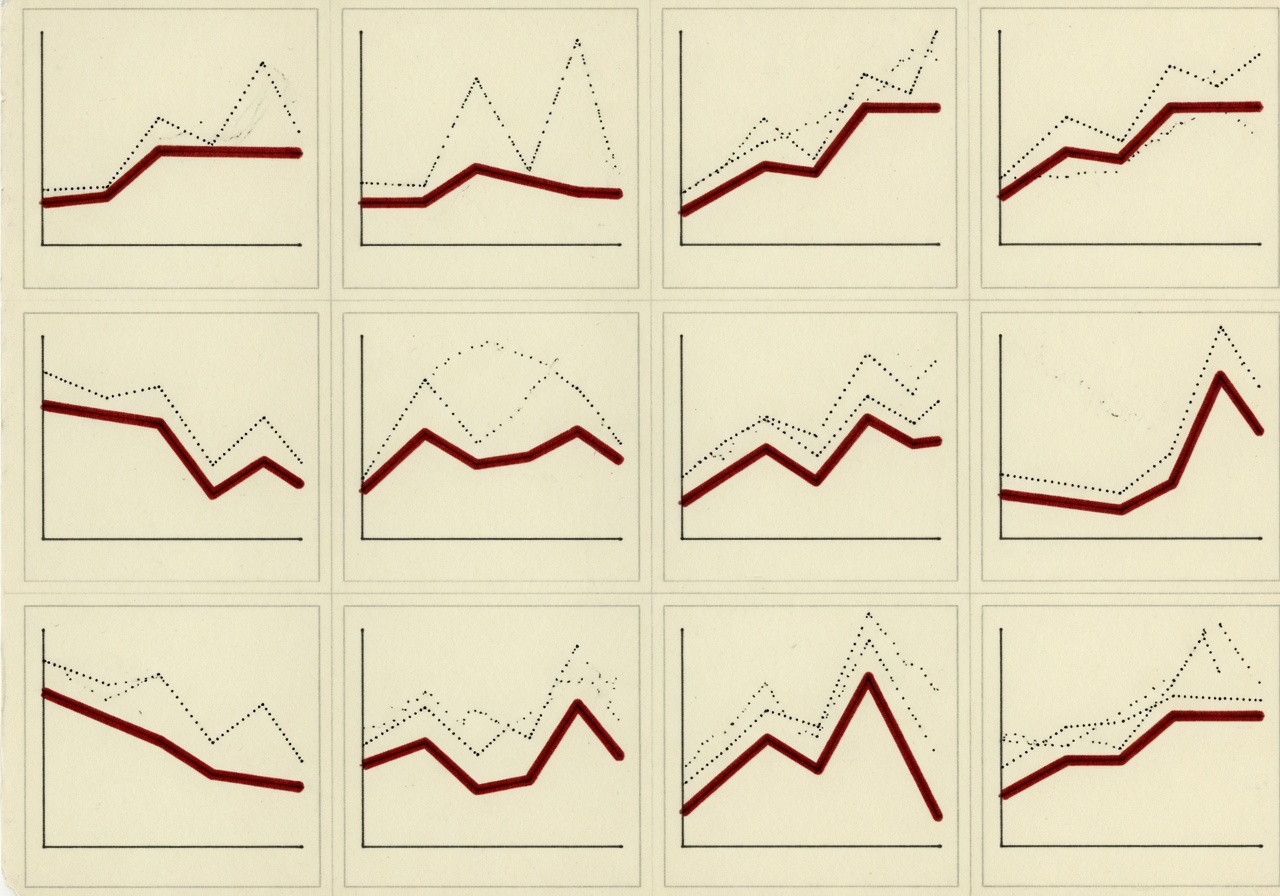
What the chart would show
A small-multiples grid is the right shape for this comparison. Twelve panels, one per industry, each with two lines: the BTOS firm-reported adoption rate over time, and the RPS or analogous worker-reported usage rate over the same window. Anchor every panel to the same y-axis, zero to 60 percent, so the eye reads the gap rather than the absolute level. The Professional Services and Financial Services panels would show two lines climbing together with daylight between them. The Accommodation and Food panel would show the firm line stuck near 8 percent and the worker line considerably higher, because line cooks and front-desk staff use translation tools and scheduling assistants their employers have never inventoried as AI.
Most workers adopt AI without it ever appearing as a required skill in a job description. — Federal Reserve FEDS Notes, 27 March 2026
Why the gap matters
The simplest reading of the gap is that workers are running ahead of their employers. A separate Federal Reserve analysis published on 27 March 2026 makes the point with a different instrument: only 5.5 percent of firms posted any AI-related job in 2025, against 10 percent of the same firms reporting AI use in the BTOS. The researchers describe the difference plainly. Most workers adopt AI without it ever appearing as a required skill in a job description. They write the prompt themselves, they paste it into a browser tab, and the firm finds out, if it finds out at all, when the productivity shows up in quarterly numbers.
For a worker at the 50th percentile of the wage distribution, the gap is the difference between two operating realities. The first is whether the firm’s formal HR policy treats AI use as approved, prohibited, or unaddressed. The second is whether the worker is using AI anyway. The Household Pulse data hint at how that second reality is distributed. The April 23 release published three AI tables (use of AI in the last two months, opinions of AI based on experience, and opt-out behavior), broken out by income band, education, race and ethnicity, sex, age, and household composition. The detailed tables and standard errors are public; the headline percentage of households reporting AI use will be the lead number to watch when the next HTOPS wave is released this summer.
There is one more reading that the data supports and one that it does not. The data supports the claim that worker-level AI use has roughly doubled the firm-reported figure across most of the economy. The data does not support the claim that the gap is driven by any single mechanism. Informal adoption, training programs that go faster than HR policy, free consumer tools used outside enterprise contracts, or any combination of these could account for the difference. The surveys do not ask the workers whether their employers know. Until they do, the gap is visible; the explanation is still inference.
What to watch
Three releases between now and the end of summer will sharpen the picture. The Census Bureau will publish the next BTOS wave on 7 May, which will include the first full quarter of data under the broadened AI question and will allow the first clean year-over-year comparison. The next HTOPS wave is scheduled for release later in the summer and will publish the second consecutive bimonthly reading of household AI use, enough to draw a short trend line. The Bureau of Labor Statistics has not yet added an AI-use module to the Current Population Survey, the official source for U.S. labor-force statistics; whether and when it does will determine whether the worker-level figure ever moves from the experimental tier to the headline tier of federal statistics. Until then, the most accurate sentence available about AI adoption in the United States is that it depends on whom you ask, and the gap between the answers is itself the most useful number.