The Bureau of Labor Statistics published the preliminary first-quarter 2026 Productivity and Costs release on 7 May, and one figure in the supporting tables is the lowest the federal government has ever measured. Labor share, the percentage of business-sector output paid back to workers as compensation, was 54.1 percent in the first quarter. The Bureau has compiled the series quarterly since the first quarter of 1947. In the 316 quarters between then and now, the reading has never been lower. The proximate context is favorable to workers in one important respect: nonfarm business labor productivity rose 2.9 percent from a year earlier, the 13th consecutive quarter of positive year-over-year growth. The share of those productivity gains that flowed back to wages in the same quarter is what the 54.1 percent figure measures, and it is the smallest such share since the data began.
The series carries a single FRED identifier, PRS85006173, and a single methodology document maintained by the BLS Office of Productivity and Technology. It is computed each quarter as current-dollar labor compensation in the nonfarm business sector divided by current-dollar output in the same sector, then expressed as a percentage. The numerator includes wages and salaries, employer-paid benefits, and the imputed labor compensation of the self-employed. The denominator is sector value added at current prices. The series began in the first quarter of 1947 at 65.8 percent. It held in a narrow band between roughly 63 and 65 percent for the next quarter-century. It first dropped below 60 percent in 2005, touched 56.0 percent at the end of 2011, and has trended down through every business cycle since.
How the 54.1 percent figure is built
The arithmetic of the headline is unforgiving. For every dollar of value added produced in the nonfarm business sector in the first quarter of 2026, 54.1 cents went to labor compensation. The remaining 45.9 cents went to capital: profits, interest, depreciation, and the imputed return on owner-occupied and rented capital. That is the highest capital share in the same 79-year window. The shift since the late 1990s is roughly eight percentage points of output. Held against a nonfarm business sector that produces something on the order of $30 trillion of annual value added, an eight-point shift represents about $2.4 trillion a year reallocated from the wage bill to the capital bill, relative to the late-1990s baseline. Not all of that shift can be read as a direct transfer; the composition of the labor force and the capital stock has changed substantially over the period. The direction, however, is unambiguous, and it is steeper than any prior 25-year window in the series.
The quarter-over-quarter change is small in absolute terms. Labor share fell from 54.4 percent in the fourth quarter of 2025 to 54.1 percent in the first quarter of 2026, a three-tenths-of-a-point move. The newsworthiness is not the size of the move; it is the threshold the move crossed. Every prior reading in the 79-year series is higher than this one. The next lower historical reading, 54.2 percent, was recorded in the third quarter of 2014. The pre-pandemic floor of 54.3 percent in 2021 had stood as the post-war record until this quarter.
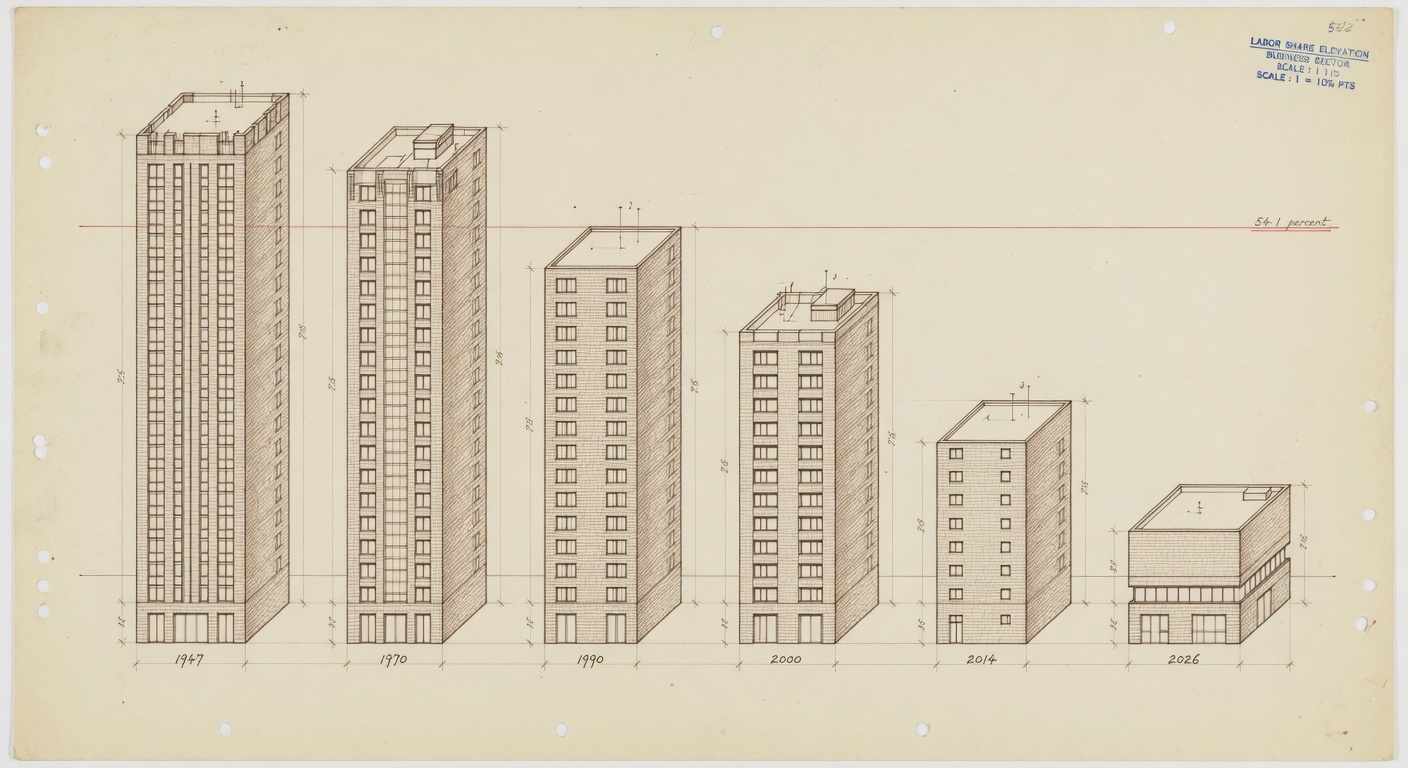
What the chart would show
The chart for this story is a long horizontal line, with labor share on the vertical axis and time on the horizontal, running from the first quarter of 1947 to the first quarter of 2026, with the y-axis truncated to the 52-to-66 percent range so the eye can read the slope rather than the absolute level. Three reference lines belong on it: the 1947 starting value of 65.8 percent, the 2014 prior low of 54.2 percent, and the new low of 54.1 percent. The chart has one job: to show that the series has never been here before. A second small inset, an architectural elevation rendered like the lead illustration, would let a reader compare the 1947 building of compensation to the 2026 building of compensation at a glance: the same output, paid out two different ways.
Just 54.1 percent of all output was paid back to workers as compensation, the lowest share ever recorded. — An Nguyen and Sneha Puri, Indeed Hiring Lab, 7 May 2026
What the same release says about pay
A reader could fairly ask whether the labor-share figure means wages are falling. They are not, in nominal terms, and they are not falling year-over-year in real terms either. The same Productivity and Costs release reported that nominal hourly compensation in the nonfarm business sector rose 3.1 percent at an annual rate in the first quarter and 4.4 percent from a year earlier. Real hourly compensation, which deflates the nominal figure by the change in consumer prices, rose 1.4 percent from a year earlier. The same series fell 0.5 percent on a quarter-over-quarter annual-rate basis, the first quarterly decline since the third quarter of 2024. Productivity grew faster than real pay over the year, which is exactly the arithmetic that produces a falling labor share: when output per hour rises more quickly than the inflation-adjusted hourly pay that buys that output, the residual flows to capital.
The Indeed Hiring Lab analysis that flagged the new low, posted on 7 May by labor economists An Nguyen and Sneha Puri, made the same observation in plain terms. The post is the clearest contemporaneous summary of the release’s implications and is the source for one direct comparison the BLS table does not draw: that labor share has now fallen by roughly 11 percentage points from its early-1950s peak of about 65 percent. The headline number, the post argues, is not just a record. It is the continuation of a 25-year drift that has not paused through one recession, one pandemic, one labor-market overheating, or one productivity boom.
What the data can and cannot tell us
The labor share figure does not, by itself, explain why the share is falling. Three mechanisms are usually offered, and the Productivity and Costs release does not adjudicate among them. The first is the substitution of capital for labor; AI is the current example, but the longer story includes industrial robotics, software, and offshoring of capital-light services. The second is the rising market power of dominant firms, which lets producers charge higher markups over labor cost. The third is the measurement of self-employed labor compensation, which the BLS imputes rather than observes, and which other agencies measure differently. The Federal Reserve Bank of San Francisco has published a working paper noting that small changes in the self-employment imputation can move the series by half a point or more.
The release also does not capture distributional questions within the labor share. A 54.1 percent labor share is consistent with a wage distribution that compresses or stretches. A worker at the 90th percentile of the hourly wage distribution and a worker at the 10th can be inside the same 54.1 cents on the dollar and have very different lived experiences of the share. The Bureau publishes a separate set of percentile and demographic breakdowns under the Current Population Survey, and those will be the next instruments to look at when the May Employment Situation is released on 5 June.
What to watch next
The revised first-quarter Productivity and Costs release is scheduled for Thursday, 4 June, at 8:30 a.m. Eastern. Revisions to the labor share series have historically been small, usually within a tenth of a point, but a downward revision would deepen the record, and an upward revision could lift the reading back above the 2014 floor. The Bureau of Economic Analysis will publish the second estimate of first-quarter GDP on 29 May, and the income-side measures in that release, particularly compensation of employees and corporate profits, are the upstream inputs to the labor share calculation. The Federal Open Market Committee, which next meets on 17 June, has begun to cite distributional labor-market measures in its post-meeting statements; whether the labor share enters that vocabulary will be visible in the June statement and the press conference that follows. The chart this article describes will be the same chart a year from now. Whether the 54.1 percent reading is a floor or a station along the way is the question the next four releases will start to answer.