The Bureau of Labor Statistics released the Producer Price Index for April 2026 at 8:30 a.m. Eastern on Wednesday. The seasonally adjusted index for final demand rose 1.4 percent on the month, the largest one-month advance since March 2022. The 12-month change rose to 6.0 percent, not seasonally adjusted, the highest reading since December 2022. Inside the headline, the composition matters more than the level. Nearly 60 percent of the April rise sits in services, and two-thirds of the services move sits in a single line item: trade-services margins, the gap between what wholesalers and retailers paid and what they charged. Margins on goods sold through the distribution chain rose 2.7 percent in April. That is the part of the pipeline that converts a wholesale cost into a shelf price.
The Producer Price Index measures the average change over time in the selling prices received by domestic producers, before the price reaches the household. Final demand is the aggregate that economists watch for early signals of where consumer prices may go next, because the goods and services in the final-demand basket are the ones sold for personal consumption, capital investment, government purchase, or export. The release publishes three layers above that: stage-one and stage-two intermediate demand, which capture the inputs flowing into producers, and processed and unprocessed goods for intermediate demand. In April every layer of the pipeline read hot. Stage-one intermediate demand rose 8.9 percent over the prior year. Stage two rose 11.1 percent. Processed goods for intermediate demand rose 9.4 percent. Unprocessed goods for intermediate demand rose 20.9 percent. None of these is a single-shock figure. The readings are the highest of the current cycle at every stage.
How the 1.4 percent figure is built
The arithmetic of the headline divides into two halves. Final-demand goods rose 2.0 percent on the month, after rising 1.9 percent in March. More than three-quarters of the goods advance is energy: the index for final-demand energy rose 7.8 percent, and within it the index for gasoline rose 15.6 percent, jet fuel rose 36.4 percent, and diesel rose 12.6 percent. The other half of the headline is final-demand services, up 1.2 percent on the month, the largest gain since March 2022. Inside services, trade-services margins drove the move at 2.7 percent. Transportation and warehousing services rose 5.0 percent. Services less trade, transportation, and warehousing, the broadest measure of the rest of the services economy and the category that includes health care, finance, and information, rose 0.1 percent. The pattern is unambiguous: the upstream shock is energy, and the downstream shock is in the part of the services economy that prices goods at the point of sale and moves them between warehouses and stores.
The 12-month figures sharpen the picture. Final demand rose 6.0 percent over the year, the highest 12-month reading since December 2022. The narrower core measure, final demand less foods, energy, and trade services, rose 4.4 percent, the highest 12-month reading since February 2023. Two months ago, the same 12-month core reading was 3.4 percent. The core series climbs by a full percentage point between the February and April releases. That is a steeper acceleration than any equivalent window in the post-2023 disinflation period.
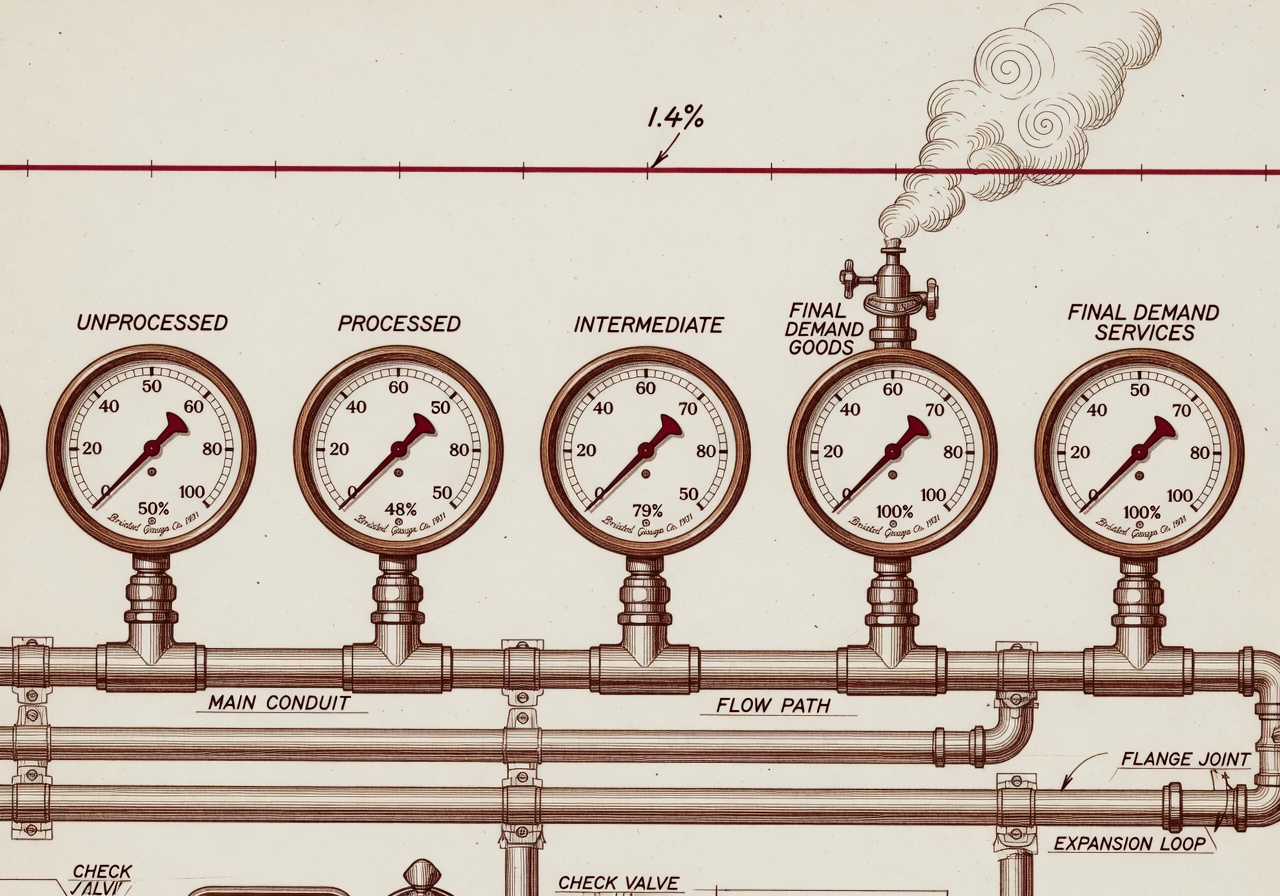
What the chart would show
The chart for this story is a stacked pipeline rather than a time series. Five gauges, read left to right: unprocessed intermediate demand on the left, then processed intermediate demand, then stage-one and stage-two intermediate demand, then final demand. Each gauge plots the 12-month percent change for April 2026 against the same series at three reference points: the cycle low in mid-2023, the start of 2026, and now. The y-axis is the 12-month change; the units are percent. The point is to make visible what the table forces the reader to assemble in their head. The upstream readings are warmer than the downstream ones, the pressure is moving in the direction of the consumer rather than away from it, and the gap between intermediate and final demand has narrowed substantially since February. The source is the BLS PPI release tables A and B.
A net 30 percent of small-business owners raised their selling prices in April, more than twice the historical average. The pipeline gauge for what they paid is reading higher. — NFIB Small Business Economic Trends, April 2026
Why trade-services margins are the line item to watch
The trade-services component of PPI is not a measure of what a wholesaler or retailer charges for a good. It is a measure of the margin between what they paid for the good and what they sold it for. A 2.7 percent rise in that margin in a single month does one of two things. Either it reflects pricing power, with wholesalers and retailers passing on more than the cost increase they absorbed, or it reflects timing, where the input costs were paid in March and earlier and the sale prices reset in April. The Bureau does not disentangle the two within the headline. The same release does offer a clue. Margins for fuels and lubricants retailing rose 7.0 percent on the month, the single largest contributor to the trade-services move. That sub-index almost mechanically tracks the lag between wholesale gasoline costs and the price at the pump. Margins for machinery and equipment wholesaling rose 5.9 percent, and margins for chemicals and allied products wholesaling rose 3.2 percent, neither of which has a similarly clean cost-pass-through story.
The same morning, the National Federation of Independent Business released its April Small Business Economic Trends survey. A net 30 percent of owners reported raising average selling prices on the month, seasonally adjusted, a five-point rise from March and well above the 13 percent historical average. A net 27 percent reported planning to raise prices in the coming months, up three points. Sixteen percent of owners reported inflation as their single most important business problem, up two points from March. The two releases describe the same dynamic from opposite ends of the transaction: PPI shows what producers received, and the NFIB survey shows what owners on the receiving end of those producer prices are doing in response.
What the data can and cannot tell us
The PPI release does not, on its own, forecast consumer inflation. The link between producer prices and the Consumer Price Index is variable and depends on which CPI categories the producer indexes feed. The energy component of final-demand goods is closely tied to the CPI gasoline index with a lag of one to two months, and the April PPI energy reading is consistent with the April CPI reading that the Bureau published the day before, in which energy rose 3.8 percent and accounted for more than 40 percent of the all-items monthly increase. The services link is looser. The PPI for trade services covers margins on goods sold; the CPI for goods covers the retail prices of those same goods. A widening margin shows up in CPI only if the underlying retail price also rises, which can be muted by inventory positions, by promotional activity, or by competition among retailers.
The series also carries known measurement caveats. The PPI for final-demand services rests on a smaller sample than the goods series; the BLS publishes the relative standard error on each stratum, and the trade-services margin index runs higher than the average for the release. The April figure of 2.7 percent is well outside the recent monthly distribution for that index, which has averaged 0.3 percent per month over the past 12 readings. The BLS will publish its first revision to the April release on 11 June, alongside the May figures. Revisions to monthly PPI changes are typically within one-tenth of a percentage point, but the size of the April move increases the absolute size that a normal-percentage revision could carry. The 6.0 percent year-over-year reading should be treated as a preliminary headline, not a settled one.
What to watch next
The May PPI release is scheduled for Thursday, 11 June, at 8:30 a.m. Eastern, paired with the first revision to April. The Federal Open Market Committee meets the following Tuesday and Wednesday, 16 and 17 June. The committee chair, recently confirmed, has not yet held a press conference under the new chair’s name; the June meeting will be the first in which the chair’s post-meeting tone is on the record. Two questions the data will start to answer. First, whether the energy spike in April was a one-month event or the start of a pipeline that pushes into May goods prices and June service prices. Second, whether trade-services margins compressed back toward their 12-month average once the pass-through window closed, or whether the elevated April reading reflects a new and stickier level. The chart this article describes, five gauges in a row, each measuring a stage of the pipeline, is the chart we will redraw with the June numbers in hand, to see how many of the needles have come back from the right edge of the dial.